What is Multivariate Data Analysis (MVDA)?

Multivariate Data Analysis (MVDA) is the set of analysis tools used to analyse and assess more than one variable simultaneously. It is ideally suited to highly dimensional complex data that might be generated by,
- Multichannel Scientific Equipment.
- Complex Modern Process Equipment.
- Financial and Stock Market Data.
- Sensory Assessments.
MVDA is highly graphical in its approach and provides a wealth of diagnostic statistics which are used to assess the quality of the models developed and also provide assurance to results generated by predictive analytics.
MVDA Methods encompass,
- Exploratory Data Analysis (EDA) and Data Mining.
- Regression and Predictive Analytics.
- Classification Methods and Preventative Maintenance.
Multivariate Methods of Analysis

Univariate and Multiple Linear Regression methods are simple least squares based approaches to data analysis typically used when the number of variables is small (1-10 variables). MLR methods can be used to model the most important variables and their interaction and square terms.
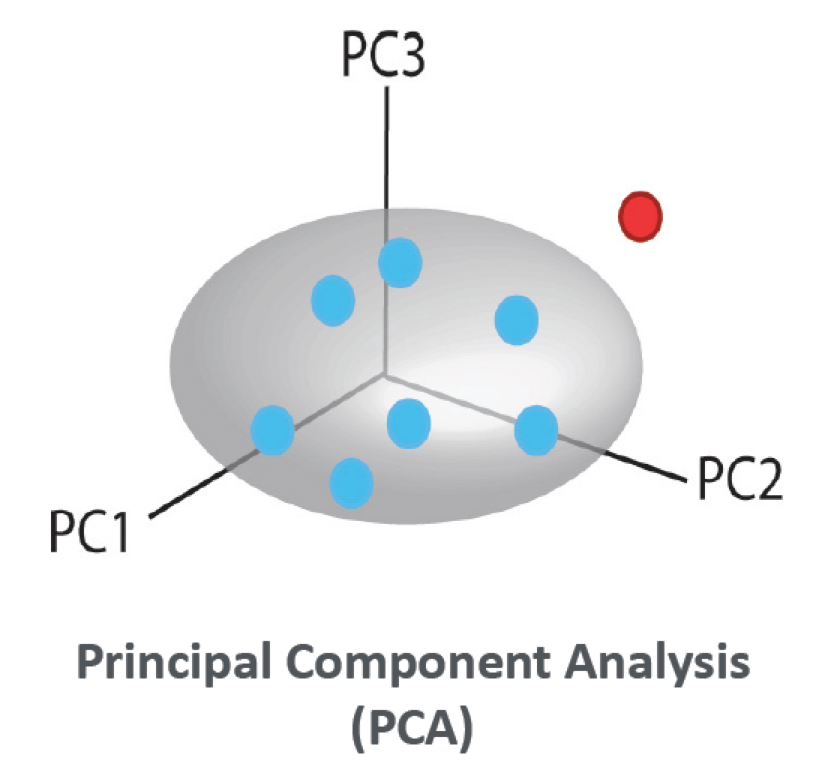
Principal Component Analysis is probably the most powerful Exploratory Data Analysis (EDA) method available. It models the similarities of objects based on the variables measured and is used to find patterns and trends in complex data sets.

Partial Least Squares Regression is not affected by the same issues as MLR with respect to collinearity. It can also be used for large numbers of variables (>> 1,000). Used to generate predictive models using multichannel instruments to replace tedious and complicated reference laboratory analyses.

Soft Independent Modelling of Class Analogy is a disjoint classification method based on a library of individual PCA models developed on known object classes. Unlike many classification methods, SIMCA is highly graphical and can also detect when an object does not belong to any class.

Partial Least Squares Discriminant Analysis is an extension of the PLS2 algorithm where an object class is defined by a binary descriptor. An object belongs to an object class when its predicted value is close to 1 within specified confidence intervals.

Support Vector Machine is a supervised machine learning algorithm used for classification and regression tasks. Its primary objective is to find a hyperplane that best separates data points into different classes, maximizing the margin between the two classes while minimising classification errors. SVM works by identifying support vectors, which are data points closest to the decision boundary, and uses them to define the optimal hyperplane. It is effective for both linear and non-linear data by employing kernel functions to map data into higher-dimensional spaces.

Extreme Gradient Boost is a powerful and efficient machine learning algorithm known for its exceptional performance in various tasks, such as classification and regression. XGBoost is an ensemble learning method that combines the predictions of multiple decision trees to improve accuracy and reduce overfitting. It achieves this by iteratively building decision trees, each one focused on correcting the errors made by the previous trees. XGBoost employs a regularised objective function and a gradient boosting framework, making it robust against overfitting and capable of handling missing data.
Univariate Methods of Analysis

Normality Testing is typically the first step before applying other parametric statistical tests to data sets. A common method used is the Shapiro-Wilk test and a data set that does not show a significant difference from the theoretical normal distribution is considered to be a normally distributed variable.

Fishers F-Test is a parametric test that compares the equivalence of variances between two samples or populations of data. Typically performed before the application of Student’s t-Test, the equivalence of variances test determines whether two sample/population means can be fairly compared to each other.

Student’s t-Test is a parametric test that compares the equivalence of means between a sample or population to a target value (one-sample t-test), two sample/population means (two-sample t-test) or the difference between two equivalent sets of data (paired t-test). These tests are used to determine whether an overall statistical difference exists between two sets of data.

Analysis Of Variance is a parametric test that assesses the within variance vs. the between variance between three or more sample sets that compose a number of replicate measurements. Used to determine whether at least one sample set can be differentiated from the others in the statistical sense. Provides important information regarding the repeatability of a set of objects.
Multivariate Statistical Process Control (MSPC)

Multivariate Statistical Process Control (MSPC) is the practical application of models developed using Multivariate Data Analysis (MVDA) to real world applications. Examples include,
- Process Control Using Process Analytical Technology (PAT).
- Multiple Sensor Assessment Using Internet of Things (IOT).
- Forecasting Share Prices and Market Trends Based on Multiple Real Time Inputs.
MSPC is highly graphical in its approach and provides detailed outputs that can be used for Early Event Detection (EED) to prevent process shutdowns before they occur, where this data can be used for Root Cause Analysis.
MSPC Outputs can also be condensed into Traffic Light Signals that are based on multiple variables all meeting specific criteria simultaneously and any deviations can signal a process engineer or process scientist to investigate further using the detailed outputs of multivariate models.